Blog
Data Science, Industry Insights
Data Science • Published on September 15, 2020
Like most startups, our original monolithic codebase, Shipotle, grew rapidly to keep up with the exponential growth of the company. It soon became a tangled blob of complex business logic and data storage. There are various efforts under way to break our monolith into microservices, but the transition will take some time. In the meantime, working in Shipotle remains on the critical path of shipping many of our new features and products. To provide immediate relief for some of the pain points of working in a large, legacy repo, we launched a team at the beginning of 2020 focused exclusively on Developer Experience in Shipotle.
One of the biggest customer complaints was that the Continuous Integration (CI) process was too slow and prevented developers from iterating quickly on their features. At Convoy, we require all pull requests to pass suites of unit and integration tests as well as style checks before we allow merges into the mainline. Because there are so many tests in the monolith, it is impractical for developers to run all the different tests locally. Most developers’ workflows usually involve only running a few tests locally before relying on the CI environment to validate their changes as well as catch any regressions on the entire test suite.
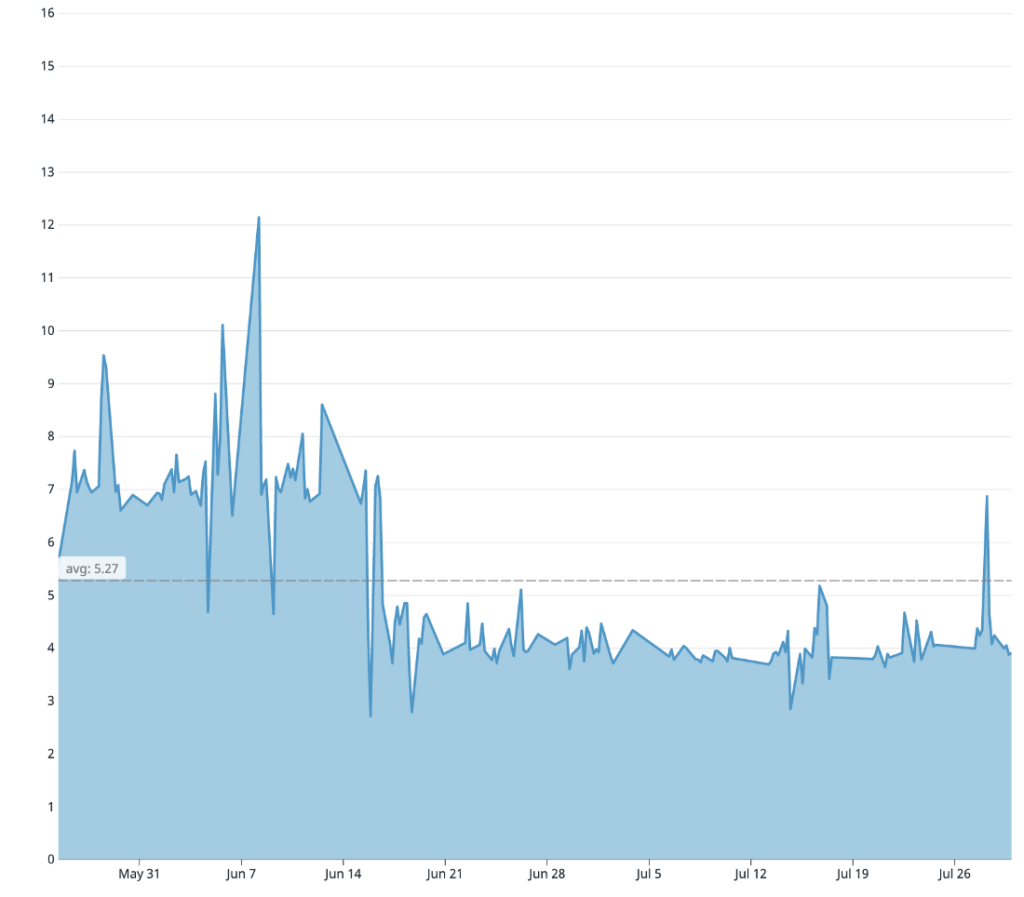
When our team first set out to tackle this problem, the CI workflow took 20 minutes. All 100+ developers in Shipotle had to pay this tax for every commit they made, and it added up to limit the productivity of the entire engineering team. In addition to costing developers a lot of time, a long CI process also requires paying for more cloud compute and directly affects the company’s bottom line. Through our work, we managed to halve the CI time to 10 minutes even as the number of tests in repo increased by over 20%.
Going into the project, our team knew that a lot of tasks would be exploratory in nature. To increase our confidence in the proposed changes, we needed to collect and analyze metrics from the CI pipeline. These metrics would also serve as an easy way to track progress over time and highlight bottlenecks that needed additional work. Luckily, the data we were looking for was readily available via webhooks from the CI pipeline. All we had to do was listen to the incoming webhooks and emit new Datadog metrics. Once the CI data was in Datadog, we were able to quickly build dashboards for easy visualization.
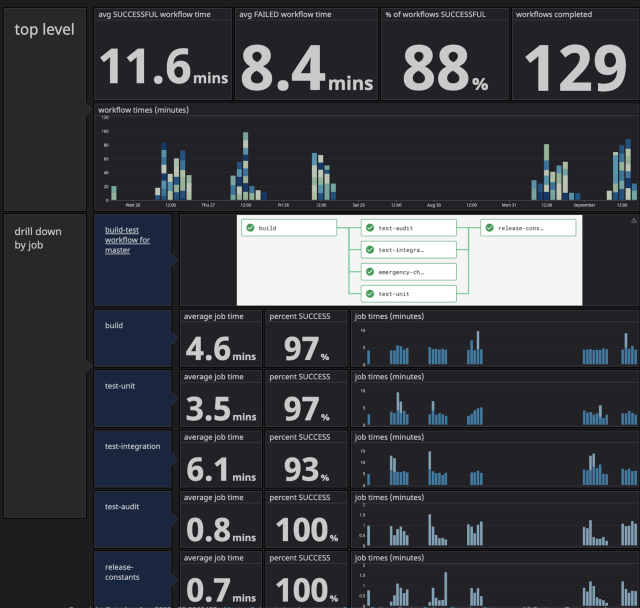
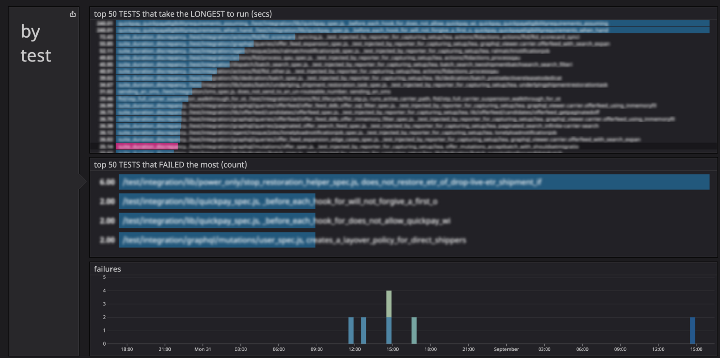
We ended up with two dashboards, build-test time and tests time. The build-test time dashboard gave us a top level understanding of the CI process and helped us understand trends over time. The tests time dashboard dives into individual tests and helps us determine which tests are slow and flaky.
With the two dashboards, we quickly realized we needed to focus our efforts on driving down the (Docker) build times and the integration test times.
At Convoy, we believe in running our tests inside of production-ready artifacts to minimize differences between environments. As such, building the production-ready Docker image is a prerequisite to running our test suites.
Our docker build has 4 main phases.
One simple trick for shaving build time off of any large and old monorepo is to leverage shallow git clones to skip downloading all of the repo’s history. We found that this simple change changed our clone times from 30 seconds to 5 seconds.
We quickly found out that steps 2 and 4 are intimately related: the fewer node modules you install, the faster the push (and pull). Docker is able to push different layers in parallel, but when a single layer contains all the node modules, the slowest part of the process ends up being the time it takes to compress thousands of files before the push.
When we first looked into our node modules directory, we realized that there were a couple packages that were duplicated over and over. Yarn why helped us realize we were pinning the version of certain packages in Shipotle’s package.json, preventing hoisting from happening within many of our required internal client libraries and resulting in many nested versions instead. Just by bumping lodash 4 patch versions upwards, we were able to remove 70 duplicate lodash copies in node modules! Systematically working through our package.json list with yarn why and yarn deduplicate, we halved the size of node modules from 2 GB to < 1 GB.
We also discovered another simple trick for shrinking the size of node modules in Docker images. Yarn install caches the package tarball in a local cache directory to prevent fetching a package over and over again. This makes a lot of sense for local development but is unnecessary for a production image. By modifying our install command from yarn install to yarn install && yarn cache clean, we further trimmed down the size of our Docker image.
In addition to reducing the Docker image size, we also looked into making the Docker build more efficient. We wanted a system that could more efficiently leverage Docker’s built-in layer reuse. In particular, installing node modules over and over is extremely wasteful and slow. We rolled out a cache system that determines if the checksum of the package.json and yarn.lock files have been encountered before. If the cache exists, we pull the corresponding Docker image that will share the same node modules layer. If not, we skip the image pull, build the image from scratch, and update the cache with the new image. It does take a bit longer to pull the cached image before kicking off the build, but that is easily offset by not needing to install or push the large node modules layer.
The other main step in our Docker build is compiling our TypeScript code into Javascript. When we first started, the compile time was taking roughly 280 seconds. We tried a variety of different experiments like increasing the machine size, breaking apart the compile into smaller chunks, and upgrading TypeScript versions. Nothing worked. In the end, it came down to a single TypeScript config flag. Our configuration had the incremental flag set to true. With incremental compiles, TypeScript is able to determine which files changed since the last compile and only type check and transpile those impacted files. Developers pay an expensive one time boot up cost for faster local iteration. However, because our production artifact does not need to be recompiled again and again, keeping this flag enabled in the Docker build is useless. In fact, we actually found that keeping the flag on greatly slows down the compile time because the compiler has to do more work to output the information necessary to make incremental compiles possible. Switching the flag off immediately caused our compile times to drop down to 130 seconds.
Generally, the simplest way to speed up tests is to increase the number of containers running them. While the overall wall clock time remains the same regardless of the number of processes, there is a cost overhead for each additional container/machine we want to launch. This is because it takes time to pull, extract, and start each Docker container. While the compute cost of running more machines scales linearly, shorter test times have diminishing returns on developer productivity. Given the limited capital we can spend in this area, it is easier to view this problem as an efficiency problem instead of just a speed problem.
Once we built out our test dashboard, we could easily identify the problematic slow test suites that were blocking the build. While we did discover a testing race condition that would cause some tests to get locked out and idle for 3 minutes, we found most of the slowness was a result of the gradual build up of code over time. Oftentimes there was inefficient or unnecessary setup and teardown logic that was copy and pasted between test files, and the only way to fix them was to work with the individual teams. Although the work was seemingly unglamorous (writing tests is hard enough, but reading tests is even less enjoyable), our team was able to document some common anti-patterns and implement some guardrails to help prevent future mistakes.
Despite our best efforts to tackle the slowest tests, we were not keeping up with the influx of new testing code, especially for the integration tests. We eventually realized that we had never bothered to question the original test running strategy. The integration tests were originally set up to run as a single test process along with the required Postgres and Redis servers and this setup had never been revisited. A quick ssh to one of the test containers and we saw that the container was being underutilized!
After that discovery, we experimented with running multiple isolated test processes via backgrounding, passing each test process its own unique Postgres database and Redis server to maintain isolation. As we tweaked the number of background test processes to run inside each test container, we closely monitored our dashboards to understand if we were causing the CPUs to thrash or if we could push the machine harder. We found our sweet spot to be 5 background test processes (and their corresponding databases) running on a 3 vCPU machine. Before backgrounding, our integration tests were consistently taking 9–10 minutes. With our current setup, the tests take about half as long and sometimes even finish in less than 4 minutes.
Working in, supporting, and optimizing a large monolithic code base can be challenging in the best of times and it can begin to feel like the legacy systems are actually slowing down progress. Although it took time for our team to get familiarized with each corner of the monolith and begin to establish a broader domain expertise, by digging in so deeply, we were able to uncover simple, high impact fixes that greatly improved the CI pipeline.
Through this work, we discovered three key takeaways:
Hopefully hearing more about our process has been helpful and you can apply some of these tricks to your CI pipeline as well!