
Blog
Data Science, Industry Insights
Data Science • Published on March 14, 2022
The idea that freight markets (similar to so many other markets) move in periodic booms and busts is well established in the trucking industry, but any practitioner will acknowledge that identifying market peaks and troughs in real time remains frustratingly more alchemy than science. Turning point predictions are frequently wrong and there is near-constant debate among industry watchers over whether an inflexion is imminent.
This technical challenge is not unique to the freight industry. Economists have long grappled with the real-time identification of turning points in areas such as finance and macroeconomic policy. Their record from decades of research suggests that there are no silver bullets, but also that there is scope for modest technical improvement from current freight industry practices.
In this blog post, we outline how Convoy Science & Analytics built upon research from the intersection of machine learning and empirical macroeconomics to help inform our team’s view of one of the trickiest, most business-critical questions for the freight industry.
Economic forecasting is sometimes likened to hiking in a dense fog: We know in intimate detail the terrain we have traveled, but have only an abstract sense of whether the next step will be into a rock wall or off the edge of a cliff. As time unfolds, there is no definitive answer to whether a single data update is a blip to overlook or the opening salvo of an enduring trend. Head fakes are frustratingly common.
The clear lesson is: While we can speculate about the forces we anticipate will shape markets on the visible horizon, there are no universal laws governing when the pendulum will swing in favor of demand or supply. Peaks and troughs are obvious only in retrospect — in financial markets, in the broader economy, and as we have learned at Convoy, in the trucking market.
But decision makers must decide, even in the presence of pervasive uncertainty — and the stakes in these judgment calls are not trivial. Predicting the direction of the freight market — in particular, spot market prices for trucking services — is essential for pricing the long-term freight contracts that large retailers and manufacturers rely on to move their products. Getting the direction of prices (much less the price itself) wrong can have catastrophic consequences for a contract’s long-term viability.
Generations of macroeconomists have dedicated careers to developing more robust tools to detect economic turning points than the finger-to-the-wind heuristics still common in the freight industry. One such tool is the recession probability calculator for the U.S. economy developed by economists Marcelle Chauvet and Jeremy Piger (see, for example, here and here).
The Chauvet-Piger approach uses a Hidden Markov Model (HMM) — trained on nonfarm employment, industrial production, real personal income, and real manufacturing sales — to identify the odds that the most recent data reflect a durable inflection point in the U.S. economy. (The official arbiter of these turning points is the group of economists who sit on the National Bureau of Economic Research’s Business Cycle Dating Committee.) It is a creative and unconventional application of HMMs, which are widely applied in diverse domains ranging from speech recognition to genomics.
Below, we provide a simple description of how HMMs work, their appeal as a solution for the problem of identifying market turning points in real time, and how we built a HMM for the freight market.
Three properties of HMMs make them particularly well-suited to the challenge of identifying market turning points:
First, the core assumptions of HMMs align with economic theory of how market prices move. HMMs model observed price changes as the random output of some underlying probability distribution. Modeling price movements as a random sequence aligns with economic theory (and empirical evidence) of approximately efficient markets across a wide range of industries.
Second, the underlying probability distribution that observed price changes are drawn from is allowed to change over time. Fitting a model to the data requires selecting a finite number of possible underlying distributions (typically called “states”) and then finding the best fit parameters (e.g., mean and variance) associated with each state. For questions about the business cycle, the number of states to select is obvious: There are two, an expansionary state and a recession state.
Third, the model outcome is easily interpreted for non-technical audiences. A key benefit of the HMM for Convoy’s application is that it allows the rigorous quantification of the probability that the most recent sequence of market data signifies a regime change (i.e., that the data shifted from one “state” to another, such as from expansion to recession or vice versa).
Consider the following example, built with simulated data.
In Figure 1, below, the red and white points in the top panel are drawn from one of two Gaussians. The red points are drawn from a Gaussian with a positive mean, which we call state 0, and the white points are drawn from a Gauissian with a slightly negative mean, which we call state 1. If we interpreted these numbers as sequential changes, then the white points (state 1) would be associated with a prolonged decline in the observed data. Points drawn as dots have been correctly classified by the HMM as being in the correct state, while points drawn as x’s have been incorrectly classified.
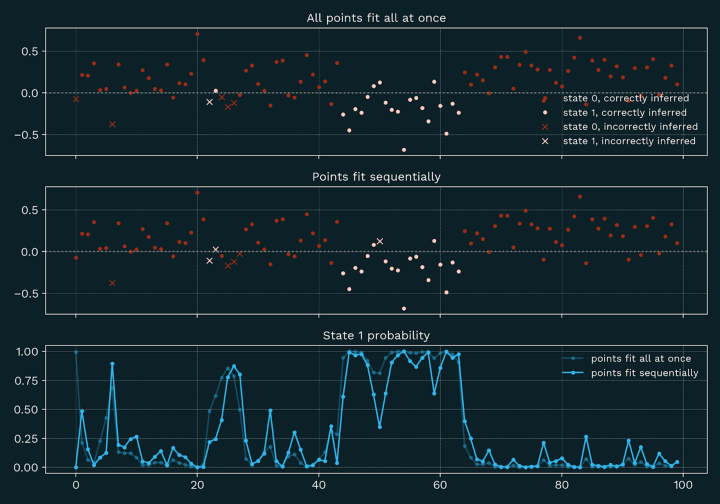
While there are a few minor misclassifications, the long stretch of white dots is classified correctly for every point when all the model is trained on the full data at once, and with only one misclassification when the model is trained on only the data observed prior to that period. The regime change is detected because the first white dot is negative enough that the probability of the system being in state 1 exceeds 50 percent (shown in the bottom panel). In the middle of the “recession” there are several white points above zero that — even though they are technically more likely to be produced by the state 0 distribution than the state 1 distribution — are nonetheless correctly classified as state 1.
How could this be? A final attribute of the HMM is that it understands that regimes tend to last for a certain amount of time. It captures this by assuming that there is a certain probability of either transitioning between states from one point to the next, or else staying in the same state. In this example we’ve specified that there is a 10% chance of transitioning and a 90% chance of staying in the same state. Therefore, an only slightly positive data point coming after a run of negative points does not offer good enough evidence for a regime change switch. You can see the corresponding probability of being in state 1 dip for these points, but only once dipping below 50% in the sequentially fit data, and even then not getting very close to zero.
Taken together, this makes the HMM an excellent tool for real-time diagnosis of regime switching. In the example above, even the false “recession” classifications don’t have a probability very close to 1. By setting appropriate thresholds, we can make a good recession detector.
Inspired by the work of Chauvet and Piger, we decided to build a HMM to identify turning points in the trucking market.
The first step was to replace the general economic indicators used by Chauvet and Piger with indicators that are more closely tied to the trucking industry and for which a reasonably long time series is available. This is not a trivial choice. While there is extensive theoretical literature (and, in some cases, statutory guidance) about the metrics to track when identifying broader economic fluctuations, the foundations underpinning freight-specific booms and busts stand on much shakier ground.
Our starting point was the intuition — derived from classical Keynesian economic theory — that fluctuations in the freight economy are driven by changes in the aggregate demand to move goods. This led to three categories of training data:
The outcome of the best-performing model — which included heavy truck and trailer production and domestic manufacturing output — is shown below. (For all of the models, we transformed the metrics to ensure stationarity and normalized to train on a two-state HMM.) We then used the following two rules to designate high-confidence freight recessions based on the probabilities that the HMM produced:
Figure 2, below, illustrates two distinct probabilities. High-probability freight recessions as defined above are indicated by the gray shaded areas.
One is the real-time probability, where at each point in time the model is trained only on data available at that moment. This is what we see in practice as the market unfolds. The second is a “smoothed” probability, which uses all the data available — historical and future — and therefore has higher accuracy and is less noisy.
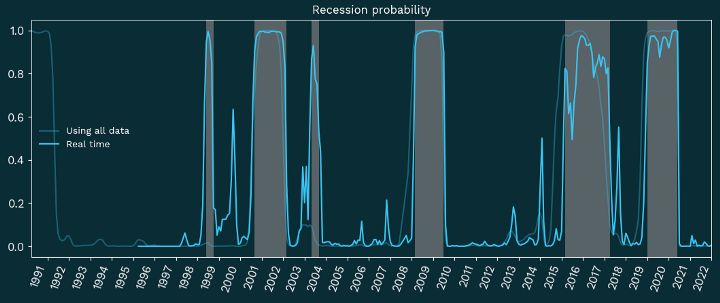
When we compare these probabilities to spot market prices for trucking services — the ultimate metric that motivated our initial interest in identifying freight market turning points — recessionary periods reliably indicate periods of falling prices, and the end of a recession is always followed by an extended period of rising prices.
The past half-decade — much less the past two years of pandemic-related supply chain disruptions — have shown us that unexpected economic shocks are not outliers; they are the norm. Determining whether a single month represents a temporary blip or an enduring market reversal has enormous consequences for any business attempting to navigate the freight market. Modern marketplaces require more precision than rules-of-thumb.
By building upon research at the intersection of machine learning and empirical macroeconomics to develop a Hidden Markov Model of freight recession probabilities, Convoy Science & Analytics has been able to help guide better business-critical decisions. There is no single silver bullet and we do not pretend that our probabilities are an all-knowing solution to the devilishly tricky problem of predicting the future. But when considered among a range of other indicators and model outputs, they can help free freight decision makers from the high-stakes guesswork that has historically exacerbated market fragilities.