Blog
Convoy News, Shippers, Tech & Visibility
Freight Research, Shippers • Published on December 16, 2020
Breaking the trend of recent months, November retail data disappointed while factory output data (released yesterday) generally beat forecasts. The combined data provide a portrait of the freight economy on the eve of the most recent wave of community lockdowns and just before the official start of the holiday shopping season
Here are a couple of things I’m watching, and what they mean for the freight industry and the broader economy:
Grocery spending increased 1.9% from October to $63.5 billion (seasonally adjusted), its highest nominal level since July and up 10.5% from November 2019. (Inflation adjusted grocery sales increased 2.2% from last month and 6.9% from a year ago to its highest real level since May.) Unofficial data sources on grocery spending suggest that important within-month trends in grocery spending might be emerging: Notably, more prominent end-of-month dips and start-of-month surges.
It’s possible that, as the pandemic has worn on and finances for some households have gotten very tight, bank accounts run empty toward the end of the month forcing these households to front-load grocery shopping once bank accounts are replenished. In my own analysis, we find some evidence that the end-of-month drop in grocery spending has become bigger and bigger over the past three months and the end-of-month drop is more prominent in states with smaller unemployment insurance benefits.
If this is, indeed, the case — some of the grocery store shortages reported in early November for staple goods might be the result of these evolving within-month consumer spending instead of pure-and-simple stockpiling as was reported at the time.
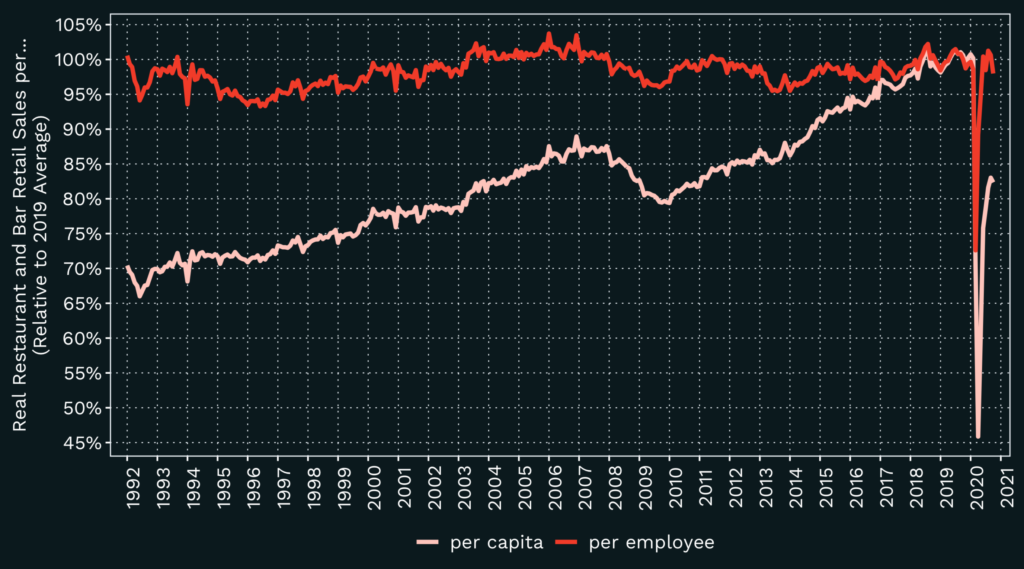
Restaurant spending dipped 4% in November, its first decline since the economy began to reopen in May, and is down 17% from a year ago. As has been the case with a number of different data sets this year, seasonal adjustment is likely distorting the month-over-month reading for this month and next. December is normally the annual peak for eating out: December restaurant and bar sales are consistently around 1.16x sales during the rest of the year. (December is also traditionally a seasonal peak for grocery sales, though less dramatically so with December real grocery sales normally around 1.06 the level of other months.)
Obviously this year will be different. There has been less eating out and more eating at home since the start of the pandemic, but since April Americans have gradually been venturing to eat out more. (Admittedly, more and more of this is take-out.)
Restaurant spending boomed over the past two decades: Between 1992 and 2019, inflation-adjusted restaurant monthly spending per capita increased from $139 to $204, with $38 of that $64 net increase (close to 60%) occurring since 2010. This year as a whole is on track to be the slowest year for per-person restaurant spending since 2001, though in the most recent months it has approached $168 per person — roughly on par with where it stood in early 2011. But businesses have largely shed workers in line with slower revenues: Monthly inflation-adjusted sales per employee are $5,435 as of November — right in line with its historic average of $5,443 and well within its historic interquartile range ($5,370 to $5,528).
Retail sales at furniture and home furnishing stores are running nearly 4% above where they stood in January (seasonally adjusted), roughly unchanged in recent months. Compared to other corners of the retail world (e.g., department stores), that’s great. Compared to what’s happening in real estate, it’s underwhelming. Existing home sales are about 26% above their January level (and accelerating) while new home sales are nearly 30% above where they stood at the start of the year (and flat).
Historically, furniture store sales track new construction home sales more closely than they track existing home sales; new housing starts are doing even better than new home sales — pointing to upside for this retail category in the months ahead. With home buyers mostly moving into larger square footage this year and, perhaps, some pandemic-induced aversion to secondhand furniture (Google searches for “Craigslist furniture” are approaching five-year lows), I would expect furniture sales to be about $250 million above where they currently are.
It’s possible that ecommerce is cannibalizing some of this category (building material and garden equipment store sales, which are harder to buy online, are much doing much better) and that slower office furniture sales are eating into demand, but another place to look is household formation: Household formation surged early on in the pandemic to its fastest pace since the early 1980s. Presumably this was the result of a newfound aversion to shared living arrangements (i.e., doubled-up urbanites in shared homes moving into more affordable space beyond city cores). This has begun to collapse and I expect there’s still substantial room for it to fall further: Extended families are consolidating, adult children are moving (back) in with parents (just as they did during the last recession), and college students/new grads are staying home.
A vaccine will help spur growth as people venture beyond their communities for the first time in months. But if anything, the last decade has shown us that the labor market scars have long echoes throughout the economy.
View our economic commentary disclaimer here.
1 This analysis is based on Convoy analysis of cross-state variation in credit card grocery spending as reported by the Opportunity Insights Project. Since Opportunity Insights reports spending indexed to the start of January 2020, we took the difference in the average index over the first seven days of each month compared to the last seven days of each month. We then regressed that change on a month index, controlling for state-level heterogeneity in the cost of living (data reported by the Missouri Economic Research Center) and the average unemployment insurance benefit. The coefficients on the month indexes become move further away from zero in the negative direction and with stronger statistical significance (indicating a larger and larger decline in end-of-month spending) for each month from August to November).