3 ways supply chain visibility can improve facility performance
Data Science, Industry Insights, Shippers • Published on June 2, 2020
Supply chain visibility gives shippers awareness of how their goods move through a supply chain. This includes tracking each shipment’s location and the facilities it passes through. It also encompasses the aggregation of data that can surface trends and anomalies, and painting the bigger picture of a supply chain’s performance.
The combination of micro and macro-level insights makes supply chain visibility a powerful tool for shippers. If you’re moving thousands of truckloads a year through a facility, even a minor recurring issue can lead to significantly higher incidentals, lower carrier satisfaction, and higher total cost to ship.
To provide shippers with a deeper level of supply chain visibility, Convoy’s digital freight network automatically collects more than 1,000 data points on every shipment. Convoy also enables carriers to provide detailed feedback on their experience at facilities. We then generate automated reports for shippers in our network, and our team of data scientists analyze information to equip shippers with insights that can improve the efficiency of their freight logistics.
In this blog, we highlight three examples of how supply chain visibility helped solve facility issues faced by Convoy customers.
Note: The following are real problems faced by real customers, however we’ve anonymized all data to protect our customer’s privacy.
Question 1: “How can I reduce detention costs at a problematic facility?”
The Problem: You’re struggling with dock bottlenecks and backups. Anecdotally, you can’t point to any specific problems or patterns.
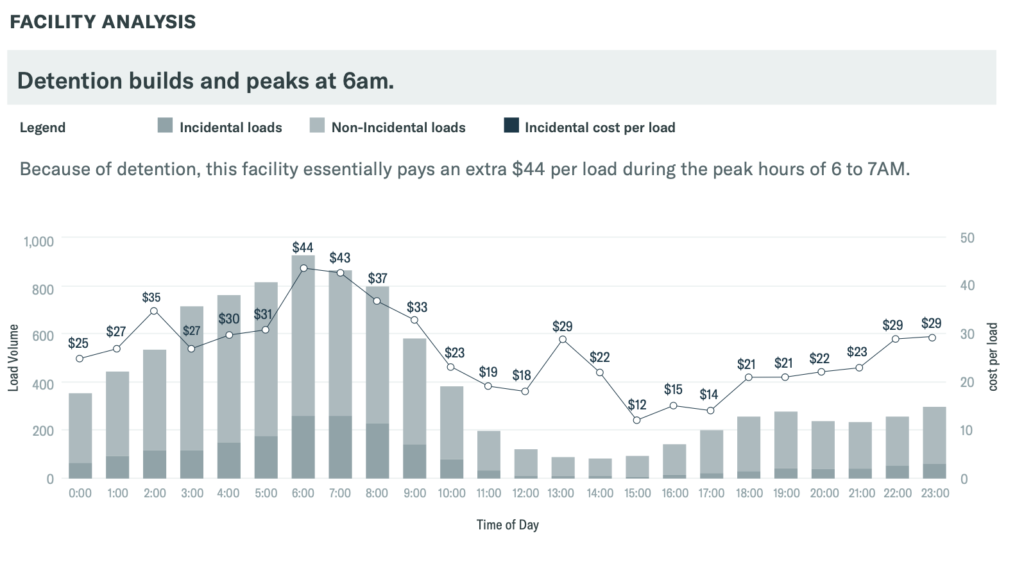
The Process: The data uncovers that detention begins to increase at 3AM, builds to a peak between 6 and 7AM, and returns to normal by 11AM. Once time of day is identified, we look at shipment volume and detention cost to uncover that you’re effectively paying an extra $40 per load during the peak hours of 6 to 7AM.
The Insight: If you shift your morning picks and drops across the afternoon and evening, you could save up to $150,000 per year.
Question 2: “What caused a jump in my month-over-month incidentals at my top facility?”
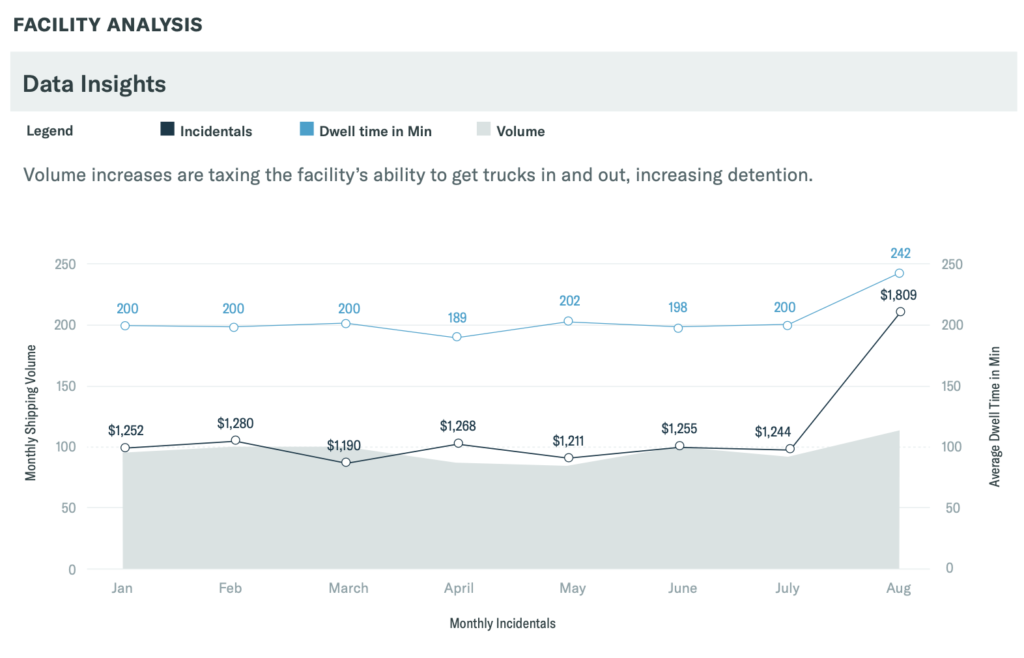
The Problem: You noticed an unexpected 23% MoM increase in incidentals at your highest trafficked facility, according to Convoy’s monthly business report.
The Process: Convoy’s investigation discovers that wait time at the same facility nearly doubled in the same timeframe, and volume increased by almost 20%.
The Insight: The volume is taxing the facility’s ability to get trucks in and out, increasing detention—the number one incidental contributor. As a next step, we look to do load balancing and rerouting to other facilities where it makes sense.
Question 3: “I have a handful of facilities in the same region—why is one responsible for a disproportionate amount of incidentals?”
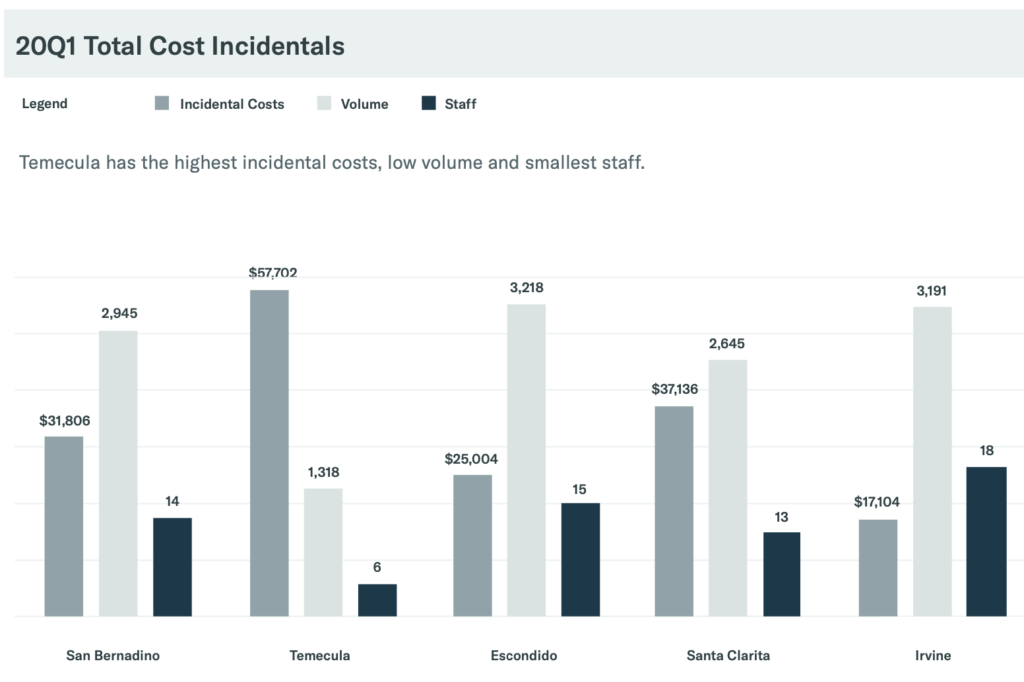
The Problem: One of your facilities experienced more incidentals in a single quarter than all your other facilities combined according to Convoy’s monthly business report.
The Process: Convoy’s data science team discovers that the facility has limited shipping windows compared to other similar-sized facilities in the network. These narrow shipping windows are the result of the facility being staffed by only five lumpers—roughly half as many as are employed at your comparable facilities.
The Insight: When schedules go awry (as schedules tend to do), the facility employees have no stretch to put out fires while also keeping the facility running at the same time. Now armed with this information, you’re empowered to make the case for increasing people resources at the understaffed facility.
Achieving supply chain visibility with a freight partner
These are just a few examples of how Convoy has helped shippers solve improve their freight logistics. While Convoy’s data and technology may seem like the star of this story, the unsung hero is our close collaboration with our clients.
We collect more than 1,000 data points per truckload shipment. Turning this data into insight requires a deep understanding of our partner’s business and the unique characteristics of their freight. In these examples, our partners had a dedicated account manager with intimate knowledge of the shipper’s business paired with Convoy’s team of PhD-level data scientists. This combination of the data, technology, and collaboration represents a new form of freight partnership that can bring visibility to your supply chain.
For a more in-depth picture of how supply chain visibility can improve efficiency in your operations, download our white paper: Supply Chain Visibility and the Digital Freight Network.
