Blog
Data Science, Industry Insights
Data Science • Published on September 1, 2021
“What are the value ranges for shipper ratings? How was this dataset compiled and how often is it updated? Are there any issues with this dataset — it seems like we’re missing timestamps from last week?”
These are a few examples of the many types of queries data scientists, product managers, analysts, and other data literate individuals ask in order to answer interesting questions about the business.
Discovering data is usually a time-consuming and manual process. Data documentation in a fast-moving startup can become outdated as the business frequently changes. At Convoy, questions and answers like the above are often recorded in team-specific Slack groups or more generic analytics boards. Amundsen, an open source project from Lyft, is a data discovery tool for indexing data and serves as a centralized knowledge repository to provide high-level descriptions of internal and external datasets. However, the most interesting and relevant information about a particular column or table is often the discussions that happen between data consumers on Slack channels.
This summer, I joined the Data Platform team at Convoy to help surface common questions about the usage of our data within Slack through Amundsen. While Convoy adopted Amundsen as our platform for discovering, understanding, and trusting data, this work can be applied to any other metadata tool (i.e. Linkedin Datahub, Uber Databook, etc.).
In this post, I’ll describe the basics of Amundsen, our goals of this work, specific processes, and conclude with our next steps.
Amundsen is a leading open source data catalog solution. It began as an internal tool at Lyft to improve data discovery and was later added to the LF AI Foundation (Linux Foundation)[1]. The value of Amundsen comes from the ease of information access/retrieval across many types of data, which reduces the time spent by data engineers redirecting people to data sources or validating questions. For example, Lyft saw a 20% increase in productivity for data scientists and analysts through the use of Amundsen.
Amundsen collects data and metadata from many sources (i.e. Snowflake, Redshift, PostgreSQL, etc.), tags each data source, and supports the underlying mechanics for indexing and search. In many ways, Amundsen is a search engine for data.
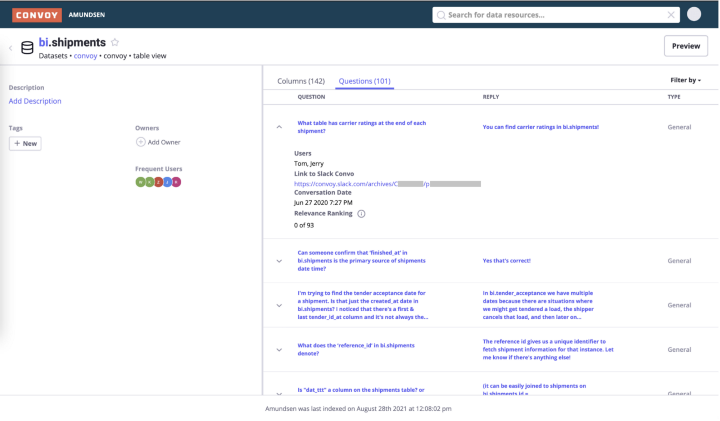
Because documentation from data sources can be outdated or confusing, our short-term goal was resurfacing prior dataset-specific questions. By allowing users to view relevant and high-quality Slack Q&As, we felt this would reduce overhead for Data Engineers (and similar roles) to answer recurrent/similar data-related questions and improve the data discovery experience.
To achieve this, we needed to ingest Slack conversations into Amundsen, which would involve:
Secondly, we wanted to annotate conversations to related data sources (if any) and further categorize the data based on rank and quality. Since we only want to process high-quality conversations, we decided to rank all table-specific conversations, find the best reply in each conversation, and classify questions into a label set for an improved UX.
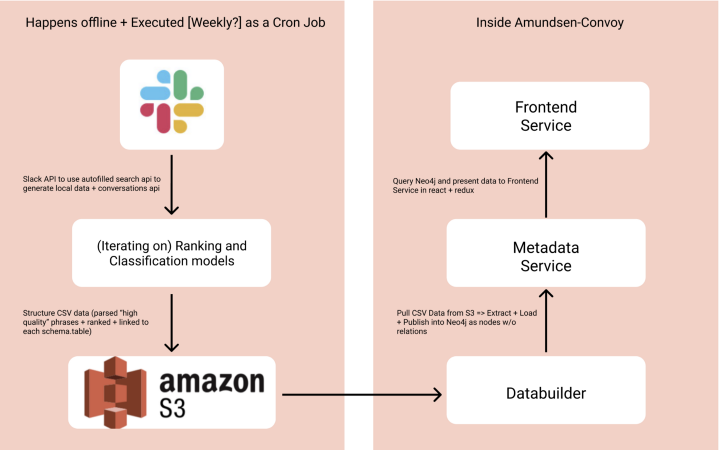
Due to the heavy API usage and Slack rate limits, we wanted our crawl feature to be an automated offline process and executed weekly as a Cron Job (time-based job scheduler)[2]. With forming the Slack corpora (left side), we used several Slack APIs to crawl our #analytics channel (where the discussions are) and then apply our ML models to further structure the data and export this information to AWS S3. In addition, we store a set of Slack-generated datasets for additional model validation and testing. Within Amundsen, we modify the databuilder and frontend/metadata service, which allows for publishing our S3 data in the tool and modifying the UI/UX of this feature.
Given our current understanding of Amundsen, goals, and a brief overview, let’s dive into the specifics!
Initially, our biggest concern for project feasibility was globally ranking conversations and linking them to particular tables on Amundsen. To simplify the problem space and increase conversation quality, we chose the Slack Search API as a baseline, along with an auto-filled search value. For this “search value”, we only used our #analytics channel, which holds the questions on SQL and data at Convoy. Additionally, we populated our tables on a generic pattern: {schema}.{table}.{id} (i.e. bi.shipments or bi.shipments.driver_id), which allows the linking of many responses to their {schema}.{table} metadata. Slack also supports finer-grained queries (i.e. users, emojis, …), so we can improve our autofill methods based on emojis or users who commonly answer questions related to a specific topic[3].
After generating these ranked responses for each {schema}.{table}, we use the Slack Conversations API to gather the entire thread for each response. Note that this data (with additional labeling) can be used as a train/test set for in-house models to handle overall conversation ranking and linking, along with our classification and ranking tasks. For example, I spent ~20 hours hand labeling the generated dataset to benchmark during ML architecture experimentation and also to understand the diction (i.e. formality, acronyms, structure, etc.). Since ML models rely heavily on data, a common saying is that garbage into a model means garbage outputs, which further signifies the importance of the quality of our data.
With the crawled responses and conversations data collected from the Slack API, we tackle two questions:
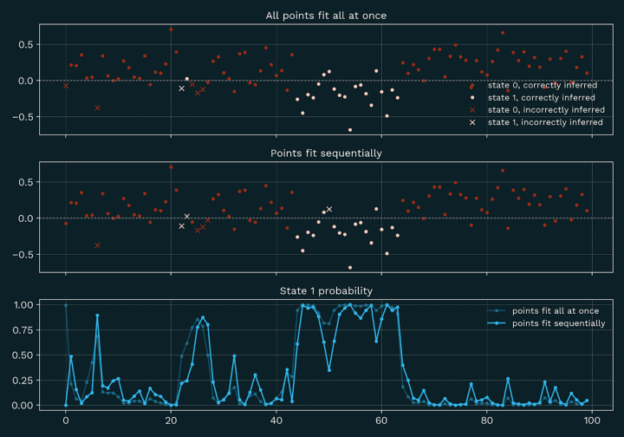
For the first question, we created a ranking model to discover the most similar response to a question and integrate heuristics to further prune the possible replies. Our initial architecture was a TFIDFVectorizer to represent the text and cosine similarity to find the closest vector. Let’s unpack both of these components.
Within ML for text data (aka Natural Language Processing), the models can only compute numerical input. We need to transform the actual words/text data into numerical representations. TF-IDF (Term Frequency-Inverse Document Frequency) is one of the simplest methods to perform this task. Common words in a document lose weight while rarer and more occurring words have more weight. There are limitations with these representations such as the loss of text order/structure and semantic or contextual information. Cosine similarity is a common method to compare how similar two vectors are, and there are other methods such as Euclidean distance or dot product[4].
For the following iterations of this model, we integrate heuristics (i.e. synonyms of thanks/approvals, reactions, etc.) or either positive sentiment responses (sentiment analysis) to reduce the set of possible replies. Additionally, we are looking to improve the representation of words with contextual and semantic embeddings (i.e. pre-trained BERT), which are different vectorization methods outside of this scope.
Regarding the second question, we create a text classification model to categorize the question as either “General” or “Issue”, which can be further fine-grained for other tags. Our initial iteration uses a TFIDFVectorizer to represent the words, but instead of a similarity measure, we averaged the values of multiple classifiers (i.e. SGDClassifier, LinearSVC, …) to output a value of 0 or 1.
For further iterations, we can also use pre-trained embeddings for better representations along with other model architecture components (i.e. LSTM/CNN, Dense layer). We also incorporate user-labeling through particular Slack reactions on any crawled conversation, which is its own category.
It is important to mention that many other ML models can be applied to our problem space, such as Question Answering Systems or much broader methods in Information Retrieval. Our main bottleneck was the amount of data being generated and crawled from our sources. If you’re curious and want to further experiment with these architectures, an active research area is weak supervision (and distant supervision) which allows us to only require labels for a small subset of the data and train models in that fashion.
The Amundsen integration involves modifying the databuilder and frontend/metadata services:
After completing an MVP, we were able to deliver on our goals to have a usable and robust Slack integration through resurfacing quality dataset-specific questions. For next steps, we’ll be focusing on productionizing the prototype to gather more feedback (which is happening at the time of this writing), further improving the modeling and data quality, and looking for methods to contribute back to open source. Additional areas to explore include crawling multiple Slack channels along with other sources of conversations data (i.e. internal service tickets). We also want to build a bot that answers commonly asked questions (analyze the text and link a document or Slack thread URL).
Connecting disparate data sources with Amundsen for ease of information organization, access, and discovery would offer a lot of exciting downstream benefits. I’m excited to see what’s in store for the future. Big shoutout to my mentor Sam Lin and manager Haibo Lin for the constant feedback and help on this project! Thanks to the many coworkers who’ve helped review and provide feedback on this blog post and my project. You’ve all helped create an amazing intern experience at Convoy for me.
— George Pu
[1] https://lfaidata.foundation/blog/2020/08/11/amundsen-joins-lf-ai-as-new-incubation-project/
[2] https://api.slack.com/changelog/2018-03-great-rate-limits
[3] https://slack.com/blog/productivity/shrinking-the-haystack-how-to-narrow-search-results-in-slack
[4] https://developers.google.com/machine-learning/clustering/similarity/measuring-similarity