Blog
Press Release, Sustainability
Freight Research, Sustainability • Published on August 1, 2019
Waste matters. For nearly every industry, waste contributes to higher costs. But in the freight industry, the stakes are even higher. In freight, waste means that more fuel is consumed, more carbon is emitted, and drivers spend more hours sitting idle. Empty miles are the primary form of freight waste.
One of the most common examples of waste in the freight industry occurs when truckers drive empty, typically because there are no nearby loads available from load boards for the driver to pick up that are headed in the same direction as the driver. In the freight industry, these miles are referred to as empty miles, non-revenue miles or deadhead miles.
Regardless of how they are labeled, these miles mean that drivers are not earning money for being on the road and the economy at large pays more to move goods. Carriers account for their own expectations for empty miles when deciding how much they charge for any particular load, so everyone from shippers down to end consumers — and, of course, the environment — ultimately pay the cost of empty miles.
Though a seemingly simple concept, putting a definitive number on empty miles has proven elusive in a fragmented and diverse freight industry. Estimates vary widely and are not necessarily comparable: Recent estimates typically put empty miles around 20 percent, but for the most familiar type of interstate freight — heavy trucks with box trailers — empty miles are substantially higher.
In this Freight Economics article, we review the range of estimates around this critical metric and explain what drives the differences in empty miles across the freight industry.
The Rearview Mirror
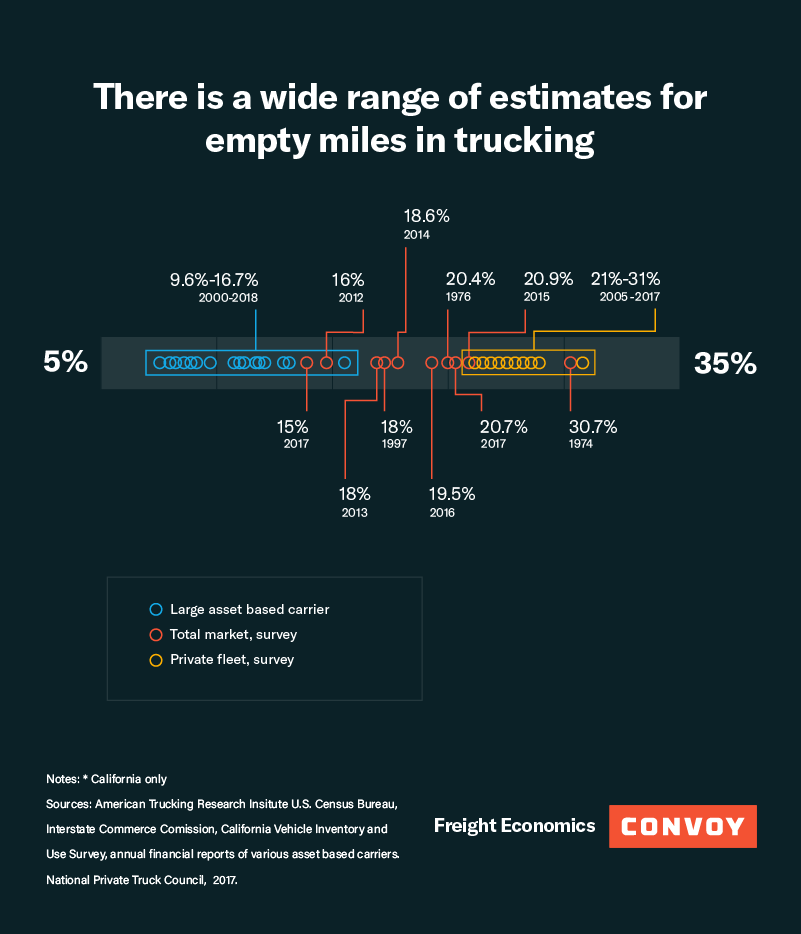
There are only a handful of independent industry-wide estimates of the empty miles truckers drive, and industry experts believe that these estimates are too low — in part because what are often reported as industry-wide numbers do not break out the wide range of very different types of trucking services. [1] (It is also possible that surveys systematically underreport empty miles due to natural human biases.) But the numbers that are available suggest remarkably little progress on reducing empty miles since at least the 1990s.
Survey estimates from the mid-1970s — the earliest published estimates that we could find — suggest that between 20 percent and 30 percent of miles driven by freight carriers at that time were empty. It appears that empty miles fell slightly by the late 1990s: Survey results from the late 1990s and early 2000s put empty miles between 15 percent and 18 percent. [2] But there appears to have been no sharp improvements since then: Surveys from the past half-decade also put empty miles in the range of 15 percent to 20 percent. [3]
Beneath the Hood
But industry-wide estimates of empty miles do not provide a complete picture of the industry. Averages can hide more stories than they tell, particularly in industries — such as freight — with diverse segments.
There are many ways to segment the different types of trucking services. One approach — which we take in this article — is to group carriers by the relationship between the carrier and the business whose goods are being hauled. [4]
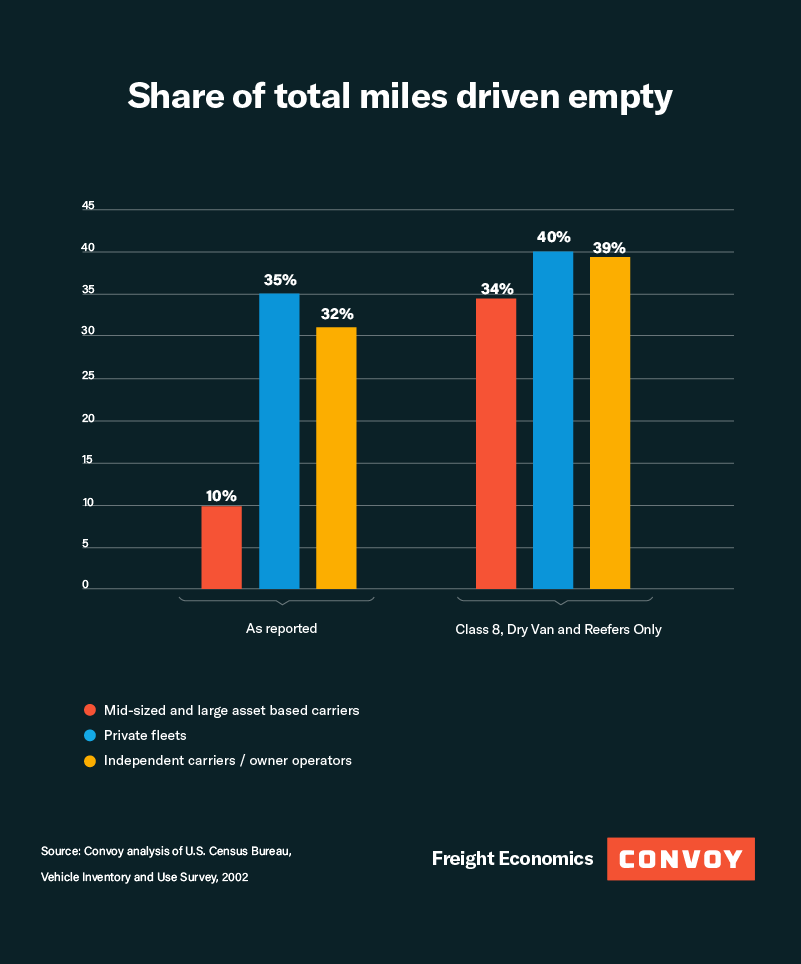
Results from the Census Bureau’s 2002 Vehicle Inventory and Use Survey (VIUS) — the most recent year the Census Bureau conducted the survey — put self-reported empty miles at 19 percent for the industry as a whole, 22 percent for private fleets, 23 percent for independent carriers/owner-operators, and 7 percent for mid-sized/large asset based carriers.
Some respondents in the survey reported driving no miles empty, which seems implausibly low and might be the result of underreporting. If we exclude these responses, then self-reported empty miles increases to 29 percent for the industry as a whole, 35 percent for private fleets, 32 percent for independent carriers/owner-operators, and 10 percent for mid-sized/large asset based carriers.
Other data sources suggest a similar range. The public financial disclosures of several large public asset-based carriers report empty miles in the range of 9 percent to 17 percent in recent years. [5] At the opposite extreme, self-reported empty miles estimates from independent carriers posted in trucker forums online can get as high as 50 percent. For private fleets, survey estimates from the National Private Truck Council range between 20 percent and 30 percent over the past decade. [6]
All in all, the range of these estimates suggest an approximate range for the different types of carriers, with percentages somewhere in the mid- to high-20s to low-30s for private fleets and independent carriers/owner-operators. For asset-based carriers, these estimates suggest percentages of empty miles in the low- to mid-teens, though as the next section shows, the shares are much higher if we control for the types of trucks and trailers, and routes that they choose to run.
Cherry Picking Apples and Oranges
On first glance, it looks like asset-based carriers drive far fewer of their miles empty than either private fleets or independent carriers. But there are also other differences between mid-sized/large asset-based carriers, private fleets, and independent carriers/owner operators. They run different types of trucks, with different types of trailers, on different types of routes. All these differences matter for empty miles.
Truck Type
Lighter trucks tend to drive fewer miles than the heavy trucks that dominate interstate freight: In 2002, the heavy trucks that dominate interstate commerce drove about 40 percent of their miles empty compared to 33 percent among medium duty trucks that are more common for intra-city freight and local deliveries. [7]
Trailer Type
Trucks with more specialized trailers in 2002 drove more miles empty:
Route Distance
Carriers that focus on mid-distance routes in 2002 generally drove more empty miles:
Apples-to-Apples
If we attempt to control for some of the differences in the types of trucks and trailers that different carriers run, the differences in empty miles quickly disappear.
Looking only at carriers operating Class 8 dry vans and refrigerated vans (reefer trailers) — the most familiar type of interstate freight — then the share of total miles run empty in the 2002 data increases to 32 percent for mid-sized/large asset-based carriers and independent carriers/owner-operators, and 35 percent for private fleets.
Back to the Future
The business motivations for reducing the number of miles freight carriers drive empty are hardly new. In a competitive industry such as freight, any cost advantage can boost a carrier’s earnings. Over time, other motivations have surged to the forefront of the industry focus as well: from fuel efficiency during the 1970s oil crisis, to air quality and traffic congestion during the 1980s and 1990s, and to carbon emissions in more recent years.
Available data suggest very little progress in reducing empty miles over the past two decades, and — until recently — the reported differences across sources are likely driven, in part, by differences in the types of routes, types of loads and types of trucks that carriers run. The most commonly reported industry-wide empty miles numbers — which typically put the phenomenon around 20 percent of all miles driven — do not necessarily reflect the most familiar types of trucks, trailers and routes. Controlling for some of those factors puts the percentage of miles driven empty in the low 30s.
In many ways, the freight industry has changed dramatically since the early 2000s; in other ways, it hasn’t. Surveys are an imperfect approach to getting a true sense of industry-wide empty miles — and probably understate reality to some degree — but for the time being they are the best way to get a comprehensive view of the phenomenon. New advances in data and technology mean it is now more realistic to make progress toward reducing this industry-critical metric — so it likely that the next two decades won’t look like the last two.
Learn more about reducing empty miles in trucking on Convoy’s Freight Shipping Guide.
View our economic commentary disclaimer here.
[1] Congressional Budget Office, Energy Use in Freight Transportation, Staff Working Paper, February 1982; Federal Highway Administration, Office of Transportation Policy Studies, Analysis of the Vehicle Inventory and Use Survey for Trucks with Five Axles or More, May 2001. From 1963 through 2002 the U.S. Census Bureau conducted a Vehicle Inventory and Use Survey (known as the Truck Inventory and Use Survey until the 1990s). The survey was discontinued in 2002.
[2] Congressional Budget Office, Energy Use in Freight Transportation, Staff Working Paper, February 1982; Federal Highway Administration, Office of Transportation Policy Studies, Analysis of the Vehicle Inventory and Use Survey for Trucks with Five Axles or More, May 2001. From 1963 through 2002 the U.S. Census Bureau conducted a Vehicle Inventory and Use Survey (known as the Truck Inventory and Use Survey until the early 1990s).
[3] American Transportation Research Institute (ATRI), An Analysis of the Operational Costs of Trucking, various years; Southern California Association of Governments, Findings from the California Vehicle Inventory and Use Survey, January 2019. Since they began asking the question in 2013, ATRI’s annual survey of operational costs has been the authoritative industry source for benchmarking empty miles.
[4] This classification is based on the variable OPCLASS in the VIUS 2002 microdata. By “small trucking company,” we mean motor carriers with 10 or fewer tractors, small trucks or other types of trucks. By “mid-sized to large trucking companies,” we mean any trucking business with more than 10 tractors, small trucks, other trucks, or trailers. We exclude light trucks (Class 1 and 2) from this analysis.
[5] Annual and quarterly financial reports. Various asset based carriers.
[6] National Private Truck Council, Benchmarking Survey Report 2017, August 2017.
[7] Medium duty trucks include weight classes 3 to 6; heavy duty trucks include weight classes 7 and 8. These results and the results presented in the remainder of this section are from Convoy analysis of U.S. Census Bureau, Vehicle Inventory and Use Survey, 2002 microdata. Here and in the remainder of this section, we include only trucks with dry van or reefer trailers reporting non-zero empty miles.