Blog
Data Science, Industry Insights
Data Science • Published on May 10, 2021
Economists on Convoy’s Science & Analytics team wear many hats — but one of the most rewarding parts of the job is collaboration with colleagues who have had long careers in more traditional corners of the freight industry. Occasionally, they mention popular heuristics or folk wisdom that circulate in the trucking industry. When possible, our economists rigorously test these ideas. Sometimes, these stories have a kernel of truth to them. Often, they are just myths.
One recent example is the conventional wisdom that the stock prices for publicly-traded asset-based truckload carriers are a leading signal for the direction of the freight market. This story sounds economically plausible — but is it true? When we tested it, we found no evidence that it holds up in the data. These results challenge a widely-held industry belief and demonstrate the importance of data and analytic rigor to a rapidly-changing trucking industry.
Economic logic suggests that spot market freight rates only capture the current supply and demand for trucks. They do not contain information about future market conditions. Conversely, the stock prices for asset-based carriers should reflect future expectations for the carriers’ profits. That is, stock prices contain more forward-looking information than freight rates.
Asset-based truckload carriers own their trucks and employ their drivers. Therefore, their costs do not respond to market fluctuations that drive changes to freight rates. However, their revenue does depend on freight rates. Given that profit is revenue minus cost, this means that asset-based carrier profits are positively correlated with freight rates.
Combining these two facts makes a plausible case that asset-based carrier stocks should capture future information about freight rates. However, this depends on the time horizon captured in stock prices. Changes in freight rates may be too short-term to affect investors’ decisions. Ultimately, this is an empirical question.
To test this relationship we need two time series: one for asset-based carrier stock prices and one for freight rates. We want to avoid a situation where we have two large sets of time series and we are testing for statistically significant relationships between all possible pairs of them. For example, if we had five different asset-based carrier stock prices and ten different freight rates, and all of these were completely featureless white noise, the probability that at least one pair would seem to have a statistically significant relationship at p<0.05 is 92%. Therefore, we want to build a single series for each of the two variables in a principled way.
To develop a time series for the price of asset-based carrier stocks we use Yahoo Finance to collect weekly historical price data for the following set of stocks:
(Two other large U.S. asset-based carriers also have publicly-traded stock: Schneider National and US Xpress. However the time series for their prices are much shorter. Including these short-series stocks reduces the available data and makes time series analysis more difficult.) We take the first principal component to collapse variation in these five stock price series to a single time series. The first principal component explains 75% of the variance across time in the price of these stocks.
To develop a time series for freight rates we use the weekly dry-van spot rates for seven high-volume long-haul lanes:
Rates on these lanes plausibly characterize the national trucking market. (Freightwaves used these seven lanes to construct its freight futures market.) Long-haul lanes are likely more responsive to national freight market conditions than local lanes. If we see a relationship anywhere it will be these lanes.
We use weekly dry-van spot rates because this is the available data set. By their nature these are less forward-looking than, for example, annual contracts. Unfortunately, no public market exists for annual contracts in the trucking industry and no data on prevailing annual rates is available. Therefore, we use spot rates as the best available data.
As above, we use the first principal component of the time series of freight rates on these seven lanes to construct a single index. The first principal component explains 90% of the observed variance on these seven routes. This shows that freight rates are highly correlated across lanes.
The following graphs show these two first principal components:
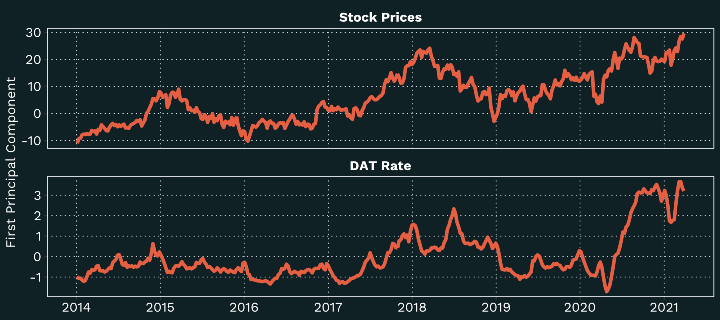
These charts might move up and down with a comparable cadence. However, visual inspection can be misleading as to actual statistical relationships. These plots do show that stock prices fluctuate on a much higher time frequency than freight rates. Some stock price fluctuations appear to have a related movement in freight-rates but the relationship is not one-to-one.
How much do stock prices predict freight rates? We know we can use historical freight rates to predict future rates. However, can we improve that prediction by adding information about historical stock prices? We can formally test this relationship with a vector autoregression (VAR). This approach jointly estimates the relationship between the stock prices and freight rates in terms of the lags of the two series.
To use vector autoregression we need to remove long-term time trends by first-differencing the series. We also normalize both series to a standard deviation of one:
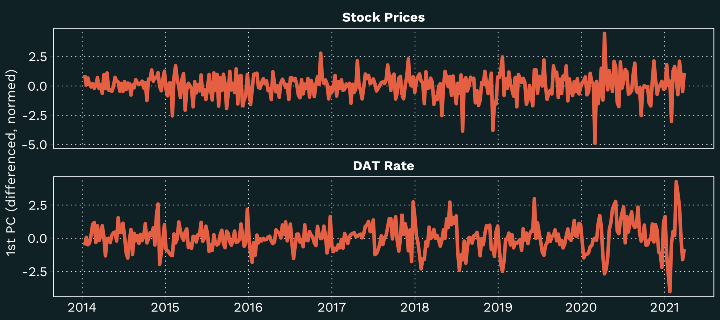
As shown, volatility in both stock prices and freight rates has increased during the pandemic era. We see relatively few drastic fluctuations in stock prices. Moreover, fluctuations do not appear to be correlated with fluctuations in the freight rates.
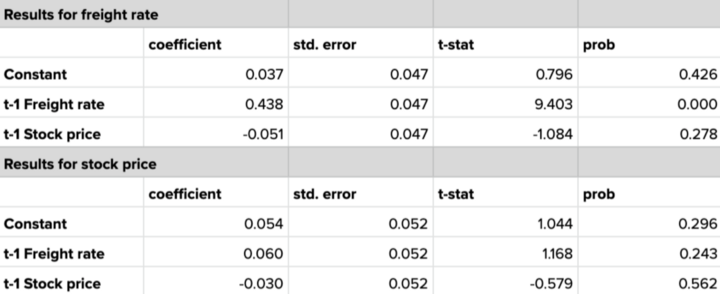
As a very first pass we can run a vector autoregression where we include all lags out to four weeks. This will test whether fluctuations in stock prices and DAT rates in the last four weeks have a causal impact on current fluctuations stock prices and DAT rates, allowing for correlation between the two series. The following table summarizes the results:
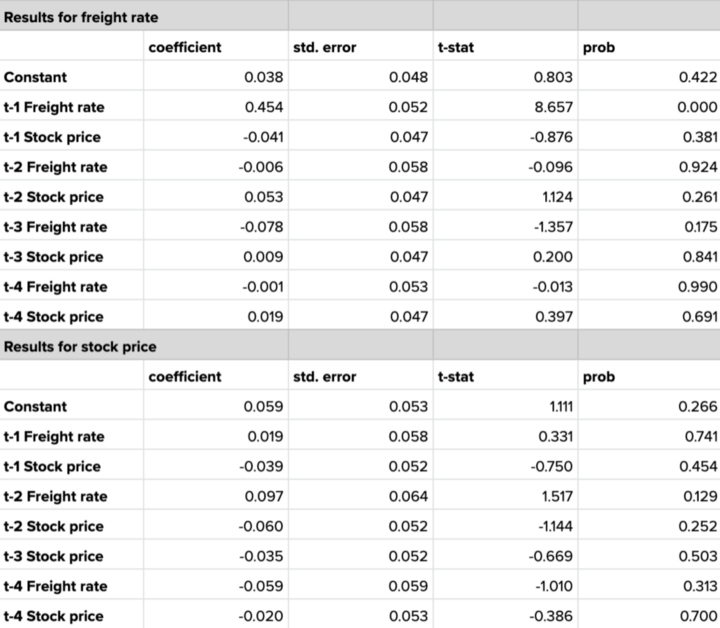
As shown, the only significant relationship in this VAR model is between freight rate fluctuations last week and freight rate fluctuations this week. Freight rates have momentum; an increase last week tends to mean an increase this week too. For example, a growing backlog of shipments in periods of low capacity could explain this momentum.
However, we see no evidence that past stock prices add any information to current freight rates. Not only are none of the other coefficients statistically significant but also their magnitudes are very small. An increase in stock prices now does not foretell an increase in truck costs later.
(Nothing affects first differences in stock prices. This is exactly what we would expect. Traders’ previous decisions on publicly available information means that only true surprises can affect prices.)
This regression uses an arbitrary four-week cutoff. We can make this result less arbitrary with some model selection. Specifically we can test all sets of lags out to 52 weeks (i.e. a year) and find the model which produces the best AIC:
As shown, this model selection prefers the single-lag model which captures the momentum in freight rates. This dominates any other model out to 52 weeks of lag. Longer-term fluctuations in freight rates and in asset-based carrier stock prices do not forecast current freight rates.
Our results suggest that asset-based carrier stock prices do not predict future freight rates as industry folklore would suggest. However, given that stock prices reflect very long-term expectations of profitability, this is arguably not surprising. Our results do show some momentum in freight rates, which is an interesting feature of the data.