
Blog
Carriers
Carriers, Data Science, Freight Research, Shippers • Published on August 4, 2021
This analysis was co-authored with Will Gagne-Maynard and Nicholas Janetos from Convoy’s Data Science team.
Class 8 truck orders are one of the most widely watched data points in the trucking industry. Freight market folklore views them as a kind of canary-in-the-coalmine: When the market is hot, they foreshadow an imminent downshift.
This makes sense. After accounting for delivery lags, higher truck orders should mean that the industry is investing in new capacity — new capacity that could become overcapacity if too much of it happens or if demand unexpectedly softens. By most accounts, this is one reason for the freight industry’s notorious boom-and-bust cycle.
The reality is, truck orders reflect not only business’ plans for the future, but also the legacy of decisions made long ago. Not all truck orders are new investments; some are replacements for older, worn-out vehicles. Our analysis suggests that the trucking industry’s commercial vehicle replacement rate is likely substantially higher than conventionally assumed.
Unfortunately, new trucks aren’t delivered with a sticker on the cab indicating if it’s replacing a recently retired vehicle — it’s something we have to estimate. Fortunately, this is exactly the kind of question that the data scientists and economists on Convoy’s Data Science team are trained to answer.
Most estimates of the Class 8 truck replacement rate (at least those that we have encountered in publicly available sources) rely on heuristics from industry anecdotes — for instance, a uniform seven- or eight-year replacement cycle or a long-term moving average of truck orders. From a data perspective, the reliance on high-level summary statistics is not ideal. More granular data — what statisticians call “microdata” — allows more flexible modeling and produces more reliable estimates (and is more fun to work with).
Ideally, administrative data would allow us to track individual trucks over time from their “birth” (manufacture) to their “death” (scrapping) — known as “longitudinal cohort analysis”. To our knowledge, such detailed records do not exist. A close alternative would be to observe the “age” of each active truck at a given point in time, and compare that distribution to the age distribution that would be expected given what we know about annual Class 8 truck production — a method known as “survival analysis” which is widely applied in biostatistics, ecology and demography.
We quickly realized that — by combining detailed operational and safety data that Convoy uses to assess the safety of trucking companies with publicly available vehicle information — we could create an original data set that would allow us to conduct a survival analysis, to provide a uniquely detailed answer to the longstanding question of the trucking industry’s Class 8 replacement rate.
From this insight, pulling the data together was straightforward.
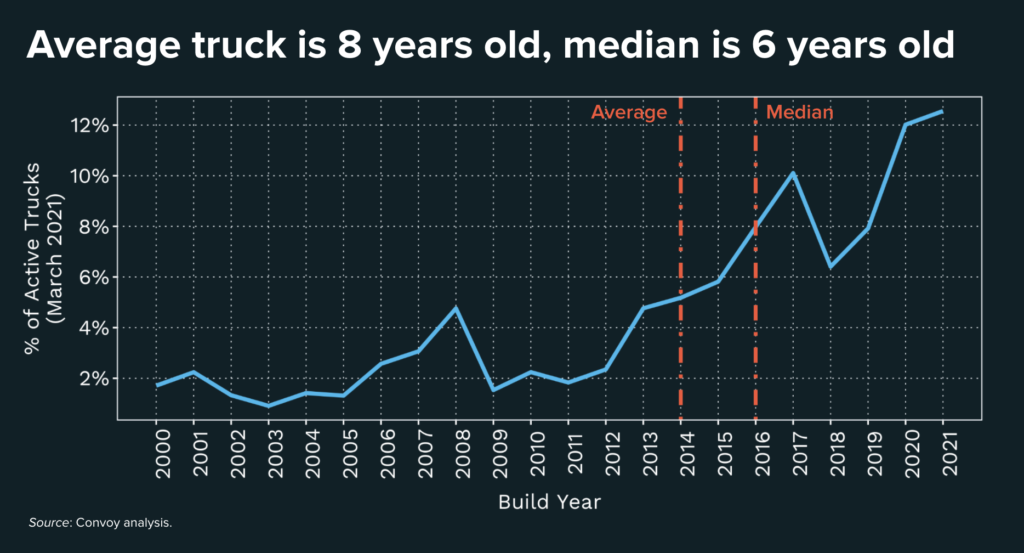
From this data set, we were able to create a snapshot of the age and “birth years” of active Class 8 trucks as of March 2021. Comparing this distribution with cumulative commercial vehicle production data published by FTR, we were able to estimate a “life expectancy” range and annual replacement rate for Class 8 trucks.
Our analysis suggests that the average lifespan of a Class 8 truck is eight years, precisely in line with conventional wisdom. Importantly, however, the age distribution is not normal: The median Class 8 truck is only six years old. A handful of older trucks drive up the national average, but the “typical” truck is substantially younger.
The implied replacement rate from these results suggests that the trucking industry needs to see annualized Class 8 truck orders somewhere between 369,700 and 374,400 (midpoint of 372,200, or 31,000 per month) in order to just keep the current level of truck capacity constant. This is somewhat higher than other estimates that we’ve seen.
As of June 2021 Class 8 truck orders are running at an annual pace of 431,000 — above both replacement rate estimates, but less dramatically so in the case of ours. (Moreover, due to elevated delivery lags associated with the global semiconductor shortage, there is a longer-than-typical delay between when new truck orders are booked and when the freight market begins to see the effect of net capacity gains.)
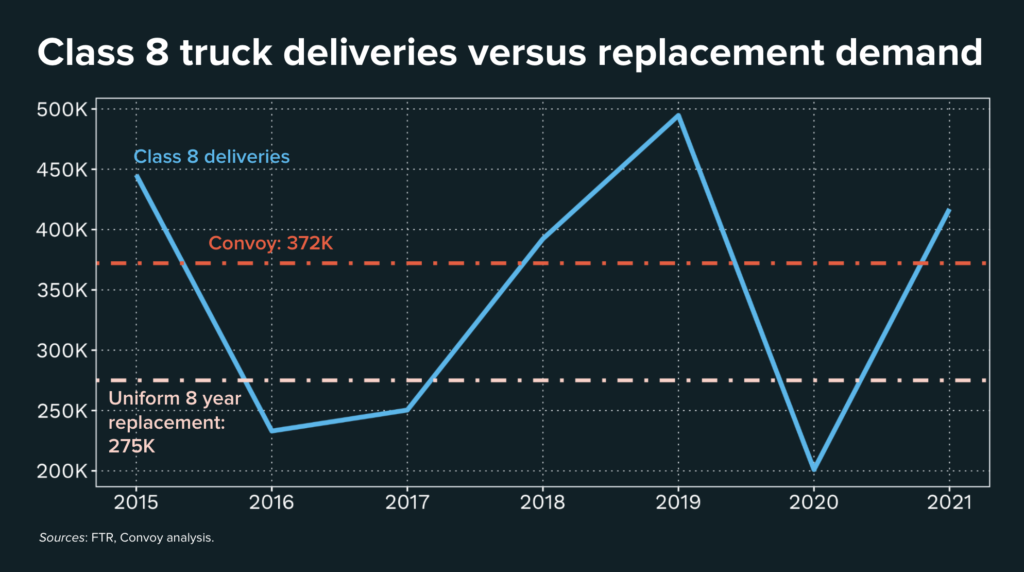
A second implication of our analysis is that the truck production deficit is larger than other replacement rate estimates would suggest. During soft freight markets — such as the market conditions that prevailed from late 2018 through early 2020 — it is not uncommon for truck production to fall below replacement needs leading to a net decline in active vehicles. Looking purely at active truck counts may understate the true magnitude of this phenomenon since some small carriers may attempt to extend the lifespan of their vehicles during lean times with the hope of deferring large capital expenditures.
Our estimate of the industry’s truck replacement rate suggests that the capital investment deficit accumulated over the past two years totaled 39,000 trucks as of June 2021, compared to a surplus of 164,000 via more conventional estimates of the replacement rate.
Class 8 truck orders are an important metric to watch for everyone with a pulse on freight market developments. Understanding what portion of truck orders represents replacement — and what portion represents net growth — is critically important to accurately interpret this industry guidepost. Get the number too high and you’ll underestimate the extent of capacity growth and downside risk to the freight market; get the number too low and you set the stage for contract failure, which exacerbates market inefficiencies contributing to waste and higher prices.
In the absence of the ideal-world data we all wish we had, we must make decisions with the messy real-world data we actually have. But real-time exigencies are no excuse for napkin math. Naive estimates drive suboptimal decisions, and the predominance of suboptimal decision making creates more problems downstream. As an industry, we can and must be more rigorous.
View our economic commentary disclaimer here.